Origin Determination
Methods – Provenance
Sampling
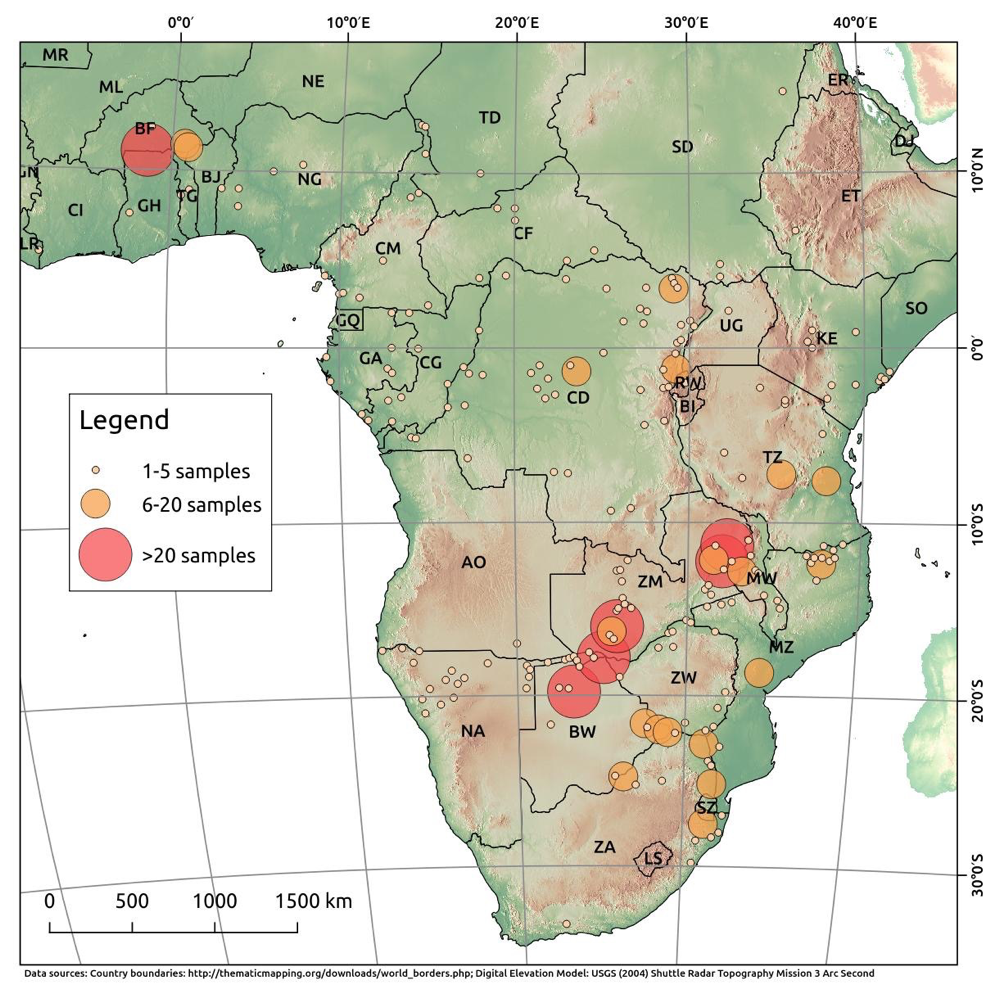
The reference data set consist of more than 700 ivory samples that were collected between 2009 and 2014 from 30 African and six Asian elephant range states from European museums and collections, trophy hunters and via protected areas and CITES management authorities in African elephant range states (Ziegler et al. 2016). The exact provenance of sampled material was not always known, but geographic locations, such as proximity to a village or a river or coordinates were curated for most of the collected tusks from more than 380 reference sites in Africa with 1-28 samples (see figure below). It needs to be stated that limited sampling size bears the risk of cutting natural variation in the respective reference sites, so that samples may be traced to a completely different area.

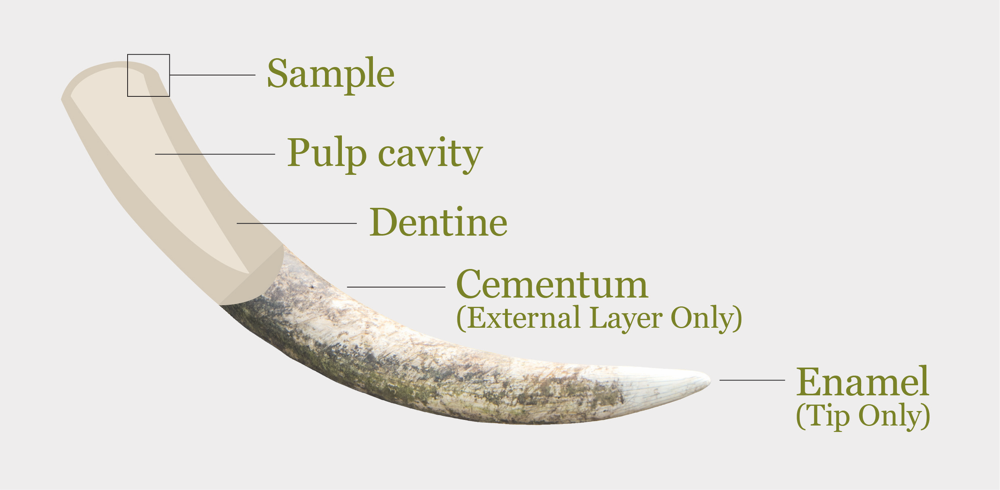
In most cases, ivory fragments of at least 30 mg and less than 2 mm thickness were taken from the most proximal end of the tusk by using a small handsaw or a pincer (see figure below). This section is largely composed of cementum, it is less than six months old and thus minimizes within-individual variation. As this is the most recently-formed and youngest part of the tusk, the isotopic signal reflects the most recent living environment. Thus, attempts to assign an individual elephant to the environment where it died should restrict sampling to the most recently-formed part of the tusks.
Tusk Morphology

Isotopic analyses
Reference samples were analysed between January 2011 and September 2015 at the accredited Agroisolab Facility for Stable Isotope Research in Jülich, Germany, according to DIN EN ISO/IEC 17025:2005 under the DAR-registration number D-PL-14370-01-00. After pulverization in a steel ball mill (Retsch MM200) with the grinding jar continually cooled with liquid nitrogen at -196 °C, samples were cleaned with dichloromethane for six hours to extract apolar substances, such as tissue fat, and then air-dried at 60 °C for 36 hours. The samples were then stored in a desiccator to avoid humidification. Subsamples of 1-4.5 mg were subjected to analysis by loading them into 4 x 6 mm tin capsules for carbon, nitrogen and sulfur isotopic measurements. Silver capsules (3.3 x 5 mm) were used for oxygen and hydrogen analysis of another split of the powdered samples. Continuous flow isotope ratio mass spectrometers measured five different stable isotope ratios (carbon and nitrogen: Nu Horizon; oxygen: Isoprime JB332; hydrogen: Isoprime JB102; sulfur: Optima A27). Results are reported relatively to the Vienna PeeDee Bemennite (δ13C), atmospheric N2 (δ15N), Standard Mean Ocean Water (δ2H, δ18O), and Canyon Diablo Troilite (δ34S) respectively and measured isotopic ratios (R) are expressed in δ units in the conventional permil notation where δ = [(Rsample/Rstandard) – 1] x 1000. The samples were also measured against a set of secondary standards (carbon: IAEA-CH-6, IAEA-CH-7; nitrogen: IAEA-N-1, IAEA-N-2; oxygen: IAEA-601; hydrogen: IAEA-CH-7; sulfur: IAEA-S-1; IAEA-S-2, IAEA-S-3) and laboratory standards (carbon and nitrogen: Leucin; oxygen and hydrogen: 1,4-Dihydroxyanthrachinon; sulfur: Cystein). In order to assess the precision of the analyses, at least two replicate measurements were performed for each sample. Analytical uncertainties were typically between 0.1‰ (δ13C, δ15N), 0.2‰ (δ34S), 0.4‰ (δ18O), and 2.3‰ (δ2H).
Statistics
All statistical analyses are conducted using the R environment for statistical computing and graphics. Reference (= learning set) and test values are normalized since no significant deviations from a normal distribution were detected in the data set. Then the Nearest Neighbour (NN) rule is applied, which builds on the rationale that samples with small Euclidian distance belong to the same class meaning that these ivory samples are likely derived from the same place of origin (Fix & Hodges 1989). The statistics uses the weighted k-Nearest Neighbour (NN) Classifier (Hechenbichler & Schliep 2004) as a pattern classification algorithm. This extension is based on the idea that such observations within the learning set, which are particularly close to the new observation (= test value), should get a higher weight in the decision than such neighbours that are far away from the test observation. For each test set, the k-nearest training set vectors (according to Minkowski distance) are found, and the classification to site, country, region or CITES Appendix is done via the maximum of summed kernel densities with k values from 1 to 15.
Uncertainty bracket
The study by Ziegler et al. (2016) illustrates that assignment accuracy fluctuates widely between 0 km and 4,821 km, particularly from countries and sites where the number of reference samples is small, such as Ghana, Togo, Nigeria and Chad. The model applied is a nominal assignment model, and as such it is only capable to model the probability of all candidate geographic locations of origin (Wunder 2012). The data show that isotopic profiling of African elephant ivory works on regional scales, so that it is possible to assign 50% of all samples within 381 km, and 75% within 1,154 km of their place of origin. This assumption may not hold for tusks of unknown origin which may derive from any location in the elephant’s range. The lack of on-site neighbours can be compensated through the assignment framework of candidate locations although median assignment accuracy increased to 876 km if all reference samples for assigning from a sampling location were removed.


